eToro - Practical examples of use |
|
Forex Online
Forex Basics Basic Charts Forex Terms Forex Hours Trading Examples Overnight tax World's Currencies Forex Platforms News & analysis Free Forex Software History of money Opportunity Forex experiences Pandemic Speculations Links |
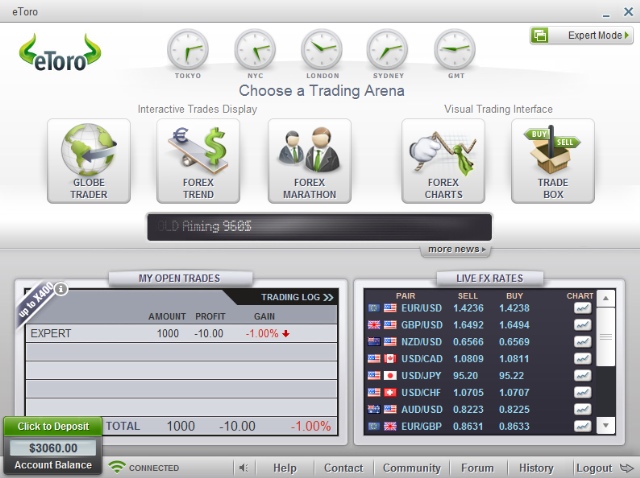
This is a brief summary of some of the functionality that the platform eToro offers to their users. Some Forex trading examples that show how easy is to trade
foreign currencies with eToro are included, too. When you enter the platform, you can choose between visual mode or so-called expert mode. Since the last one
seems to be a difficult thing, for experts, let's explain it right now. You'll see immediately how easy and intuitive are operations to buy or sell currency pair,
with just a few clicks.
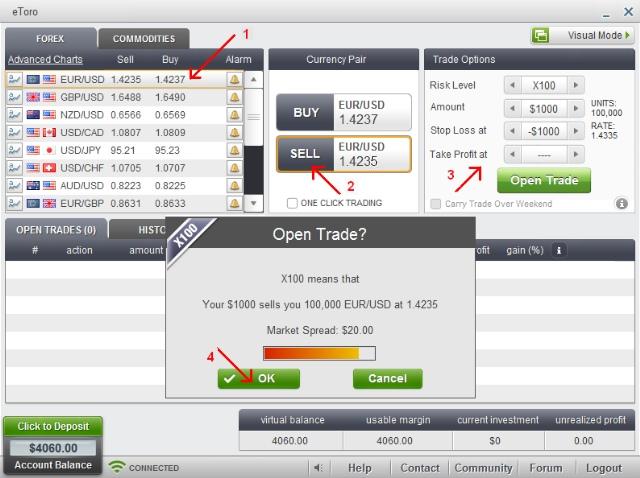
Open position
The operations to do to open a position, indicated with red arrows and relative numbers, are described bellow.
Limits modification
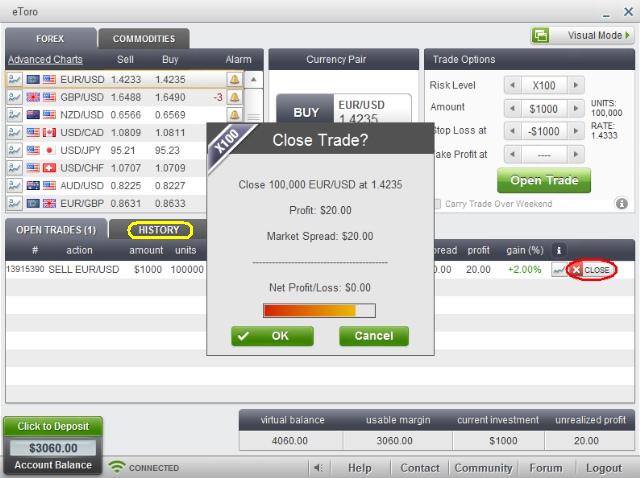
Once the position is opened you can change one or both of the limits of the same position: automatic closing of the position to limit the loss (Stop Loss), if the trend is unfavorable to you, and / or self-closing to take profit (Take Profit) when the price reaches desired level. The picture above shows the procedure to change the limit "Take Profit". The same would be a way to change "Stop Loss". To change the value of "take profit" you must click on the relative button (circled in red). One window will open where you can change the value by changing the monetary amount of profit or by varying the rate of closure. Of course, changing one of the two, the other value automatically changes. Once you set the value to what you want, you must press "OK" button to confirm the new limit. Close the position manually
Having set the limits for the stop of the loss and the profit taking, the position will close automatically if one of the limits is reached. If for any reason you want to close the position manually, at any time you can click with mouse on the button "Close" (circled in red) and then click the button "OK" to confirm the closure on the new window that will open. All closed position are moved in history field. To access the history area, you must click the tab "History" (circled in yellow). You can see the content of history field on the next image. History
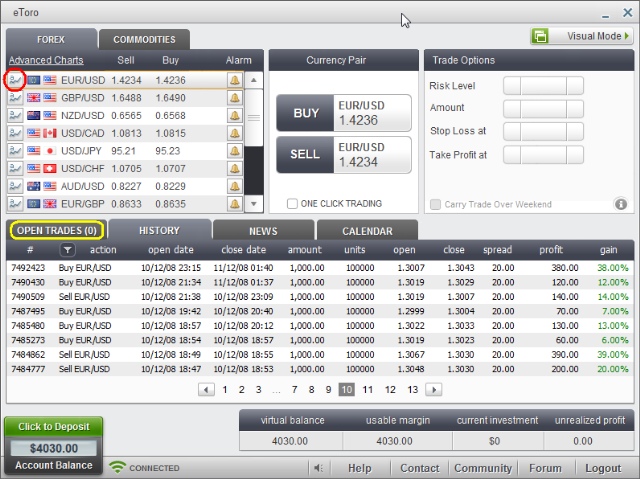
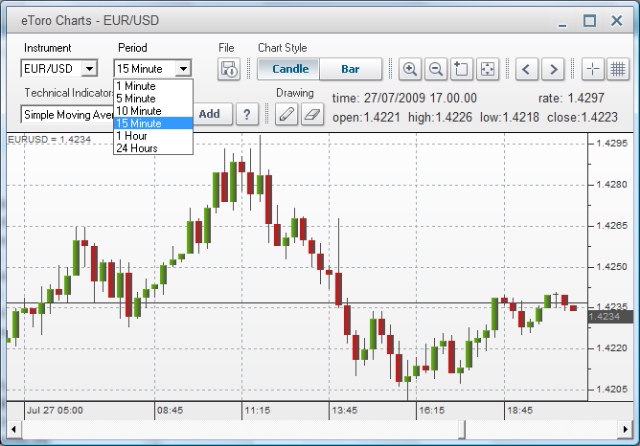
In the history area all closed positions are listed together with the most relevant data of their performance. Reading from the left to the right we have the number of operation, type of action (buy or sell) and the currency pair involved, the opening and closing dates and times, the amount invested and the capital managed with invested amount. Follow the opening and closing rates, the spread and profits or loss achieved with the percentage gain. The transactions are listed in chronological order and higher listed are more recently executed. To return to the previous screen click the tab "Open Trades", circled in yellow. Examining better this window, as well as those listed before, you can see tabs and buttons of other features that eToro offers to clients: the online help with explanations about the meaning of the options, contact the staff and access to the community and forum, where you can exchange ideas and opinions with other users. You can also view the news in real time from the world of finance and see the calendar of events important for the evolution of the prices of currencies. The Forex tab are relative to the currency pairs, while if you click Commodities tab you can trade gold and silver. At the left of the lines with currency pairs, there are buttons to access the charts that show evolution of the rate of the currency pair we are interested in. It's circled in red the button of the pair EUR / USD, and the relative graph you can see below. ChartsThe charts offer a range of options that allow you to adapt representation to our personal taste. First of all, you can choose from a basic chart or an advanced one. The last one is shown on the picture below. As you can see, chart can be represented with traditional style bar, lines or with the candles. You can choose the period of representation from 1 minutes to 24 hours, various technical indicators and you can also draw lines and curves. Among other things, the chart can be saved on your personal computer for the future analysis. Moving the mouse cursor over a candle you obtain all the characteristic values for the relevant period; the rates of opening and closing, and the high and low price of the pair.
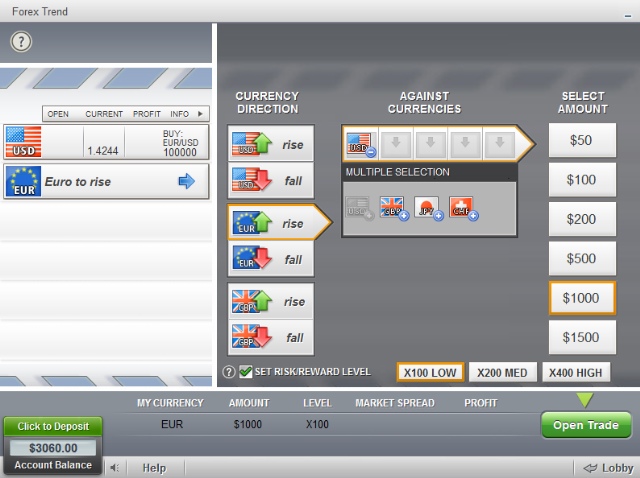
The above chart also shows the high volatility of exchange rates in certain periods. On the graph you can see the evolution of EUR / USD in the day 27 July 2009, in periods of 15 minutes. Observe the difference between the highest price on the chart of 1.4297 at 11:45 a.m. and the lowest one of 1,4203 at 16:00 (4:00 p.m.). In about 4 hours, the price was dropped by 94 pips. Exploiting this decrease would mean earning 94% of invested capital, using the leverage 1 to 100, in just 4 hours and no other exchange market may offer the opportunity to so high profit. Visual modeFor completeness of presentation, let's see briefly one of the five visual modes that are available to the trader. After seeing how simple is the use of the expert mode of the eToro platform, maybe wouldn't be correct to say that the visual mode is simpler. Indeed, it is just easy as expert mode, but this mode is offered to meet the personal tastes and to allow the user to choose the most suitable for him.The window on the visual offers to client 5 different visual interfaces called globe trader, forex trand, forex marathon, forex charts and forex trade box. All interfaces are interactive, choosing one of the options you pass the selection to another one. Since all is very simple and intuitive, only the screenshot of the mode "forex trend" is shown here.
In the "forex trend", the image below, we choose one of the currencies and the expected trend, rise or fall, (column "currency direction"). For example, we have chosen the euro that rise. The box that we chosen will indicate us, with an arrow, the next column we must elaborate, in this case is "Against currency". Here we indicate the currency that make pair with the euro: we indicate USD. Having made this choice on the right we will see a series of boxes with the amount to be invested and we choose one of those proposed. At the end you can choose, at the bottom of the screen, the level of risk: 100, 200 and 400. Made all the choices we press the button "Open Trade" and one window appears that allow us to confirm or to abandon the operation. Really easy, isn't it?
|